MCA-2022
MCA Project
2449288
| Contents |
|---|
| Title and Introduction |
| Week 1 |
| Week 2 |
| Week 3 |
| Week 4 |
| Week 5 |
| Week 7 |
| Week 8 |
| Week 9 |
| Week 10 |
Title and Introduction
Theme: I will be looking at Vivaldi’s Violin Concertos, specifically, Vivaldi’s Four Seasons
Antonio Vavaldi (1678 - 1741)
Vavaldi’s Violin Concertos, specifically Il Cimento dell’Armonia e dell’Inventione translated as The Contest between Harmony and Invention (Op. 8, published in 1725) This peice is more commonly known for it’s first four movements - the four seasons.
Week 1
Task: Based on your own experience, what do you think are some challenges to working with music and music-related data (perhaps related to access, curation, distribution, etc.)? How does your selected theme display some of these challenges? Describe the current manifestations of data relating to your selected theme, discussing how it is presently curated (collected and gathered) and how it is presented, described, and analysed.
Challenges
There are many challenges when working with music and music-related data. While there are many data-bases available storing and describing vast amounts of music data, from Sheet Music Library’s such as IMSLP/Muse Score, to Digital libraries such as Spotify, there are limitations to music and storing data.
Looking at sheet music databases, while the information on these sights can be analysed for data on the title, composer, quality of said data - a lot of the data is stored as photos or as audio samples. It required a secondary element such as a human to them turn that photo into understanding the music. If you can even call it music in that pure form. Another challenge that is present perhaps specifically in music-related data that Spotify might use, is there is minimal context to the data they collect. Other than the information on the song, and perhaps basic data on the listener, there is no information on the mood of the listener or why they are listening to X or Y, which could impact the data being produced.
The most obvious example is in relation to live performance. Whilst technology can produce near-perfect examples of music, the uniqueness that live performance brings is something that can never be truly replicated. The musicality that comes with playing a peice live is hard to record in data form. This is perhaps most clear when comparing playback from a music software (such as Sibelius) to a live performance, but arguably also recorded music, even if the recording itself is from a live performance. There will always be aspects from the atmosphere and performance that are not captured or have limited ability to be demonstrated in recorded music.
How does Vivaldi’s Violin Concertos display these challenges?
Being a such a renowned peice of music, there are plenty of recordings and notation of Vivaldi’s Violin Concertos available in a simple google search. The question of a live performance is valid here. String instruments are complex instruments to play, and with many subtle performance techniques, each performance is completely unique (even if from an untrained ear they sound identical). Music-data cannot reproduce what techniques are used and distinguish these subtleties that live performances can.
Another challenge that applies to Vivaldi’s Violin Concertos is that the popularity of his works means there are vast amounts of recordings and music online, and it is often hard to tell exactly who published everything and if the recordings were official or not. The databases can provide some information here, but cannot examine the authenticity of the recording themselves, and we are reliant on the supposed factual information given to us by the author or uploaded of said material on the data base.
Data and Vivaldi’s Violin Concertos
Vivaldi’s Violin Concertos and in fact Baroque music as a genre has multiple platforms in which it exists. It is curated in the simplest form using its Opus number, a number which is unique to the work itself allowing any database to identify it.
Vivaldi’s Violin Concertos score can be found in many sheet music library’s, with many forms, adaptions and variations on the original. Most Baroque pieces have been carefully copied and printed from original manuscripts and reproduced for the masses, becoming commercially democratised and used by many from professional orchestras to individuals how they wish.
Vivaldi, being seen as an important figure and composer, being classified as part of the first Viennese School of composers, alongside Mozart and Beethoven, have been rigorously studied and who’s works for many forms part of their basic musical education. Their pieces are scrutinised for certain theoretical techniques and practices that are considered vital by many for understanding Western-European classical music and therefore some under academic scholarly review constantly. Most recently now in relation to White supremacy and decolonisation, sparking new debates on the hierarchical, high-brow view of certain composers and genres in music and music education.
Week 2
Task: Download and edit a peice of music on musescore from OMR technology.
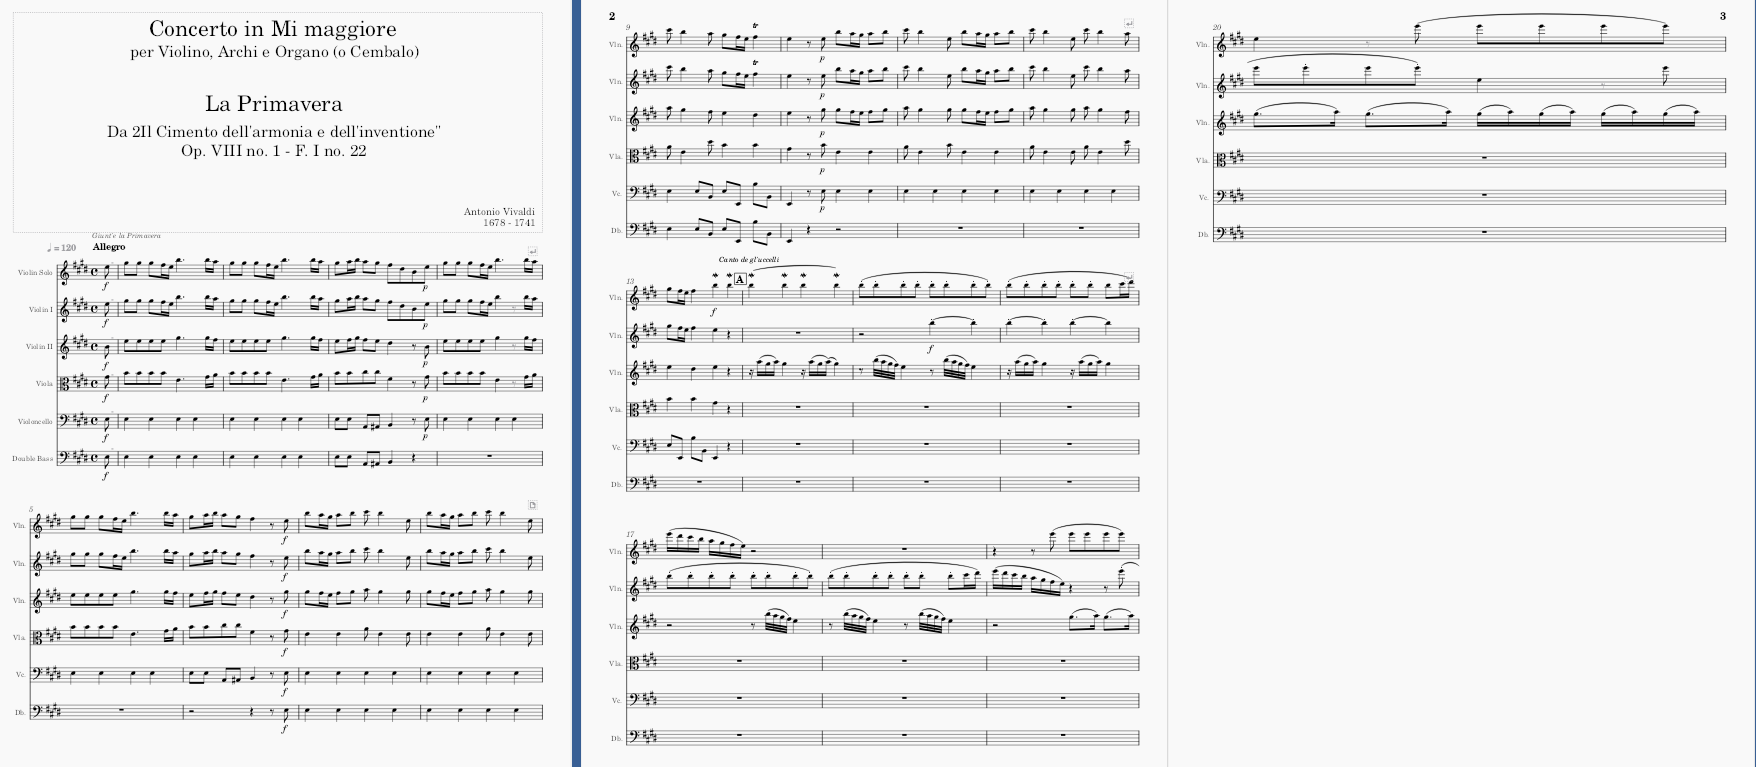
PDF file used: Four seasons spring pdf.pdf
OMR results
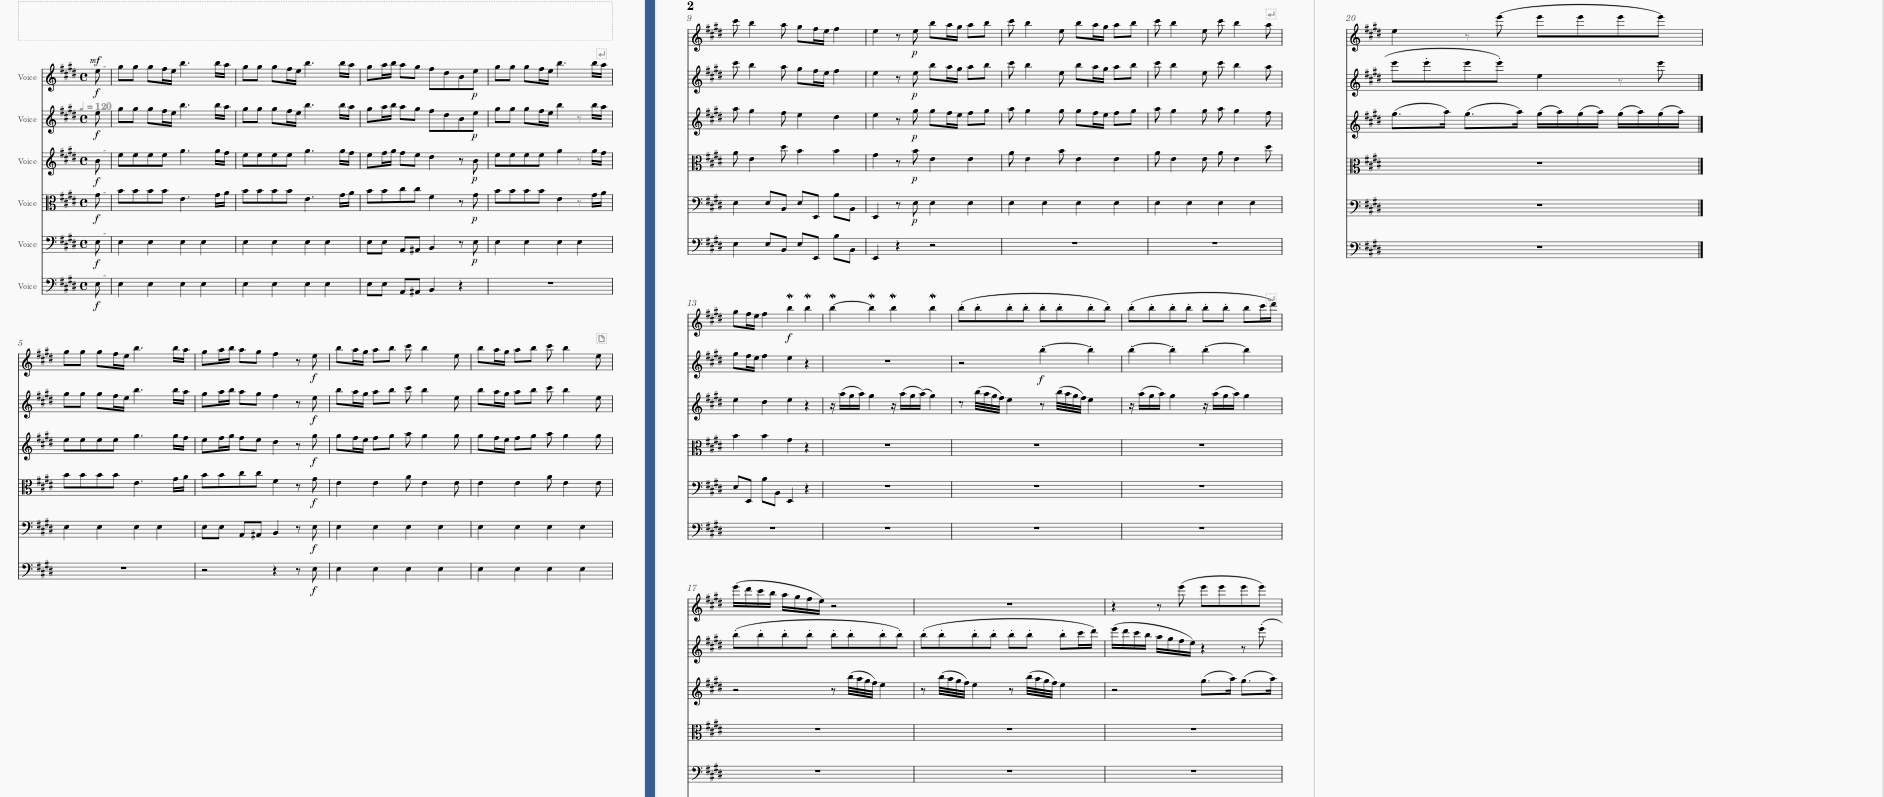
Corrected score
Observations
The initial OMR technology was pretty accuratate, specifically in terms of notes, pitches and rhythms. Key elements missing: Metadata such as title, composer etc. Tempo markings and instrumentation (thought violin was a voice) Alterations: had to change instruments to a voice and then copy and paste the material onto the new staves, still the staves were not braced the same as the original, had to spend a bit of time discovering how to brace the staves properly. The mothod I found that worked was by adding in a piano stave which is already braced then changing the cleffs to the correct forms, however this may cause an issue in playback as the computer may think the sound is still a piano rather than a voice. Perhaps the editorials functions in Musweascore are limited, perhaops this is due to my own persoinal lack of knopwlegde of musescore, but overall, whilst the presentation may be correct, the further element of if the music created from musescore out of the PDF was played allowed would it have the desired effect the sheet music presented? Not in the iniitial case of the OMR, it requitred user intervention to alter the sounds. There is also a question of aaesthetic or practicality here in the limitations of musescore. (e.g. braced staves or accurate sounding instrumentation!)
Week 3
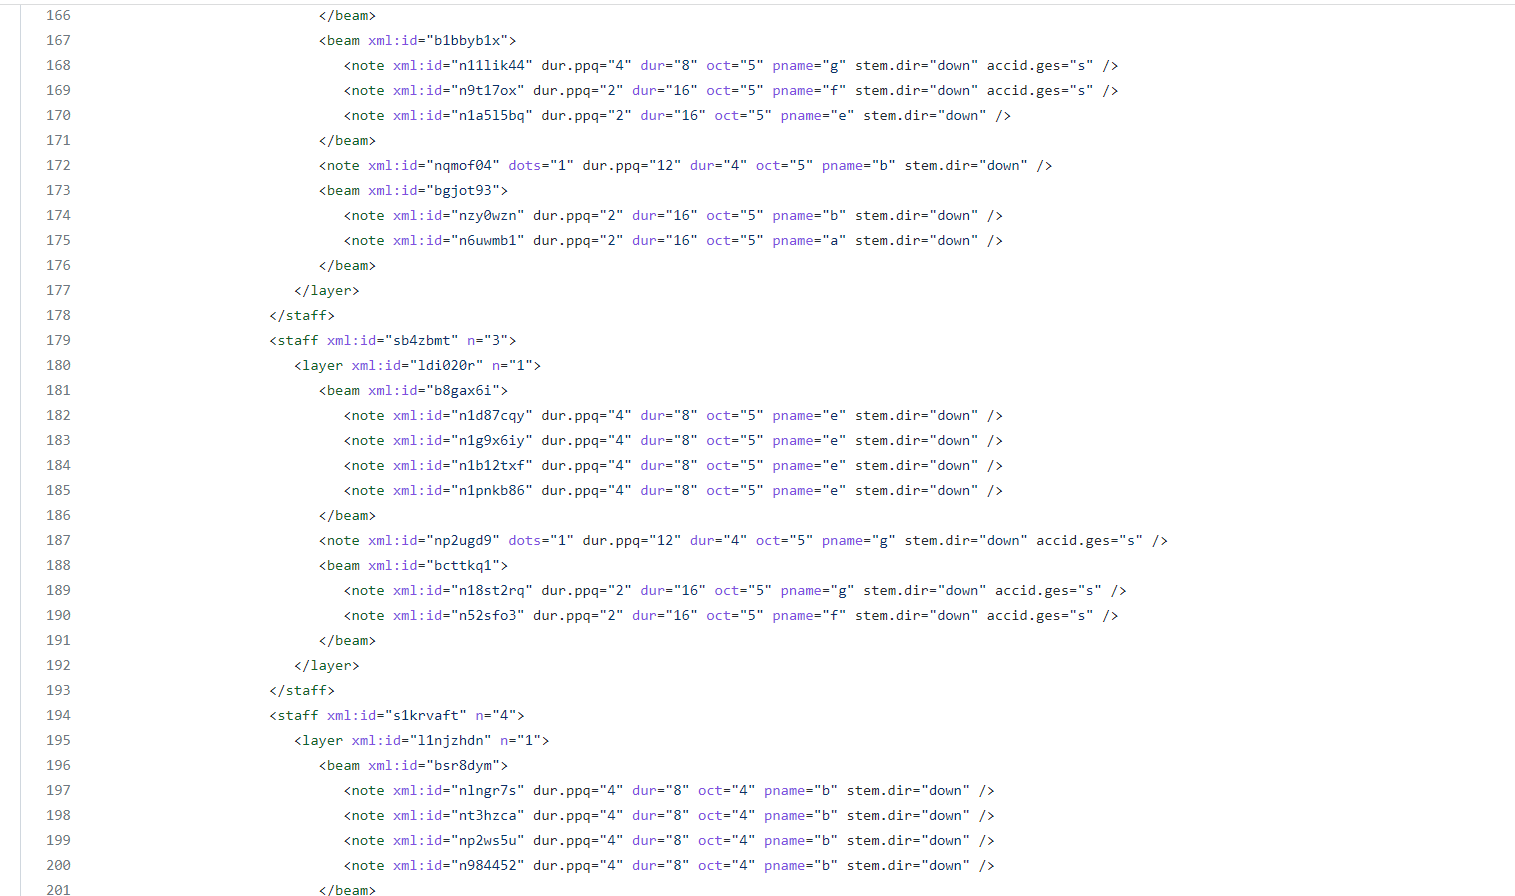
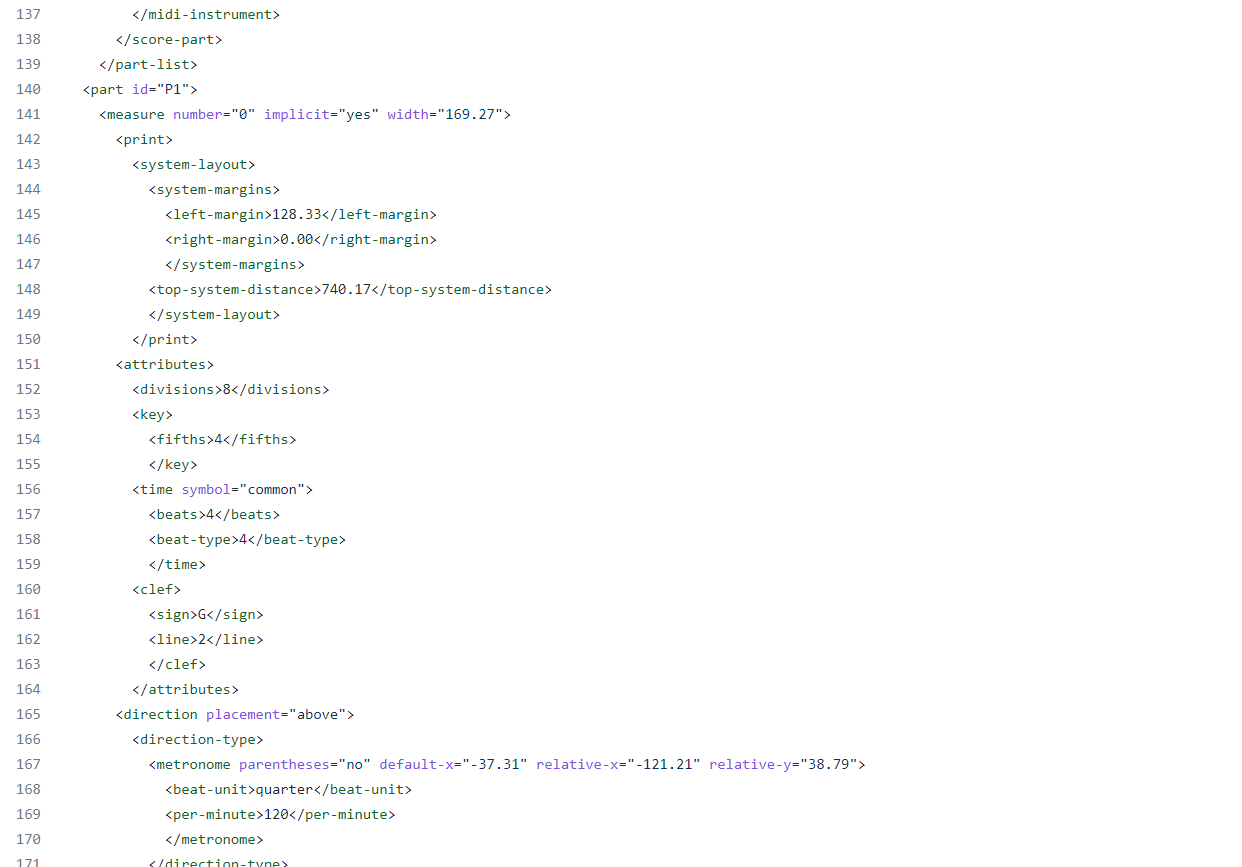
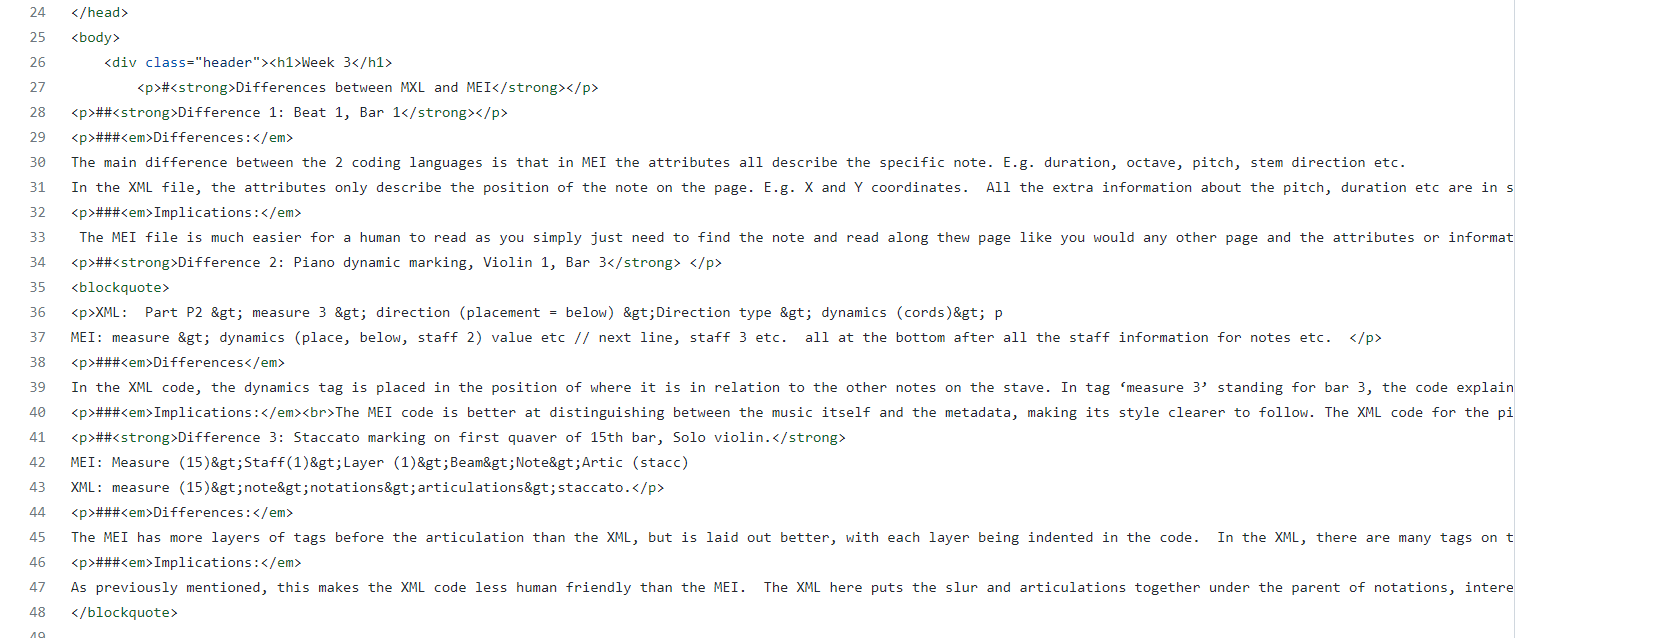
TASK: In the space provided on the verovio.html page, compare 3 elements in the MusicXML file to the corresponding ones in MEI. Think about: which attributes can be employed in each standard, which parents and children can be used, and try to think of the implications of these differences.
Week 4
TASK:
1. Generate a jSymbolic analysis of your piece. Be sure to export your piece as a MIDI file before trying to run jSymbolic, and select a group of features that you think is most interesting and relevant to your particular piece.
2. Use the Python notebook on the Moodle to generate a piano roll and pitch histogram of your piece using music21.
Part 1
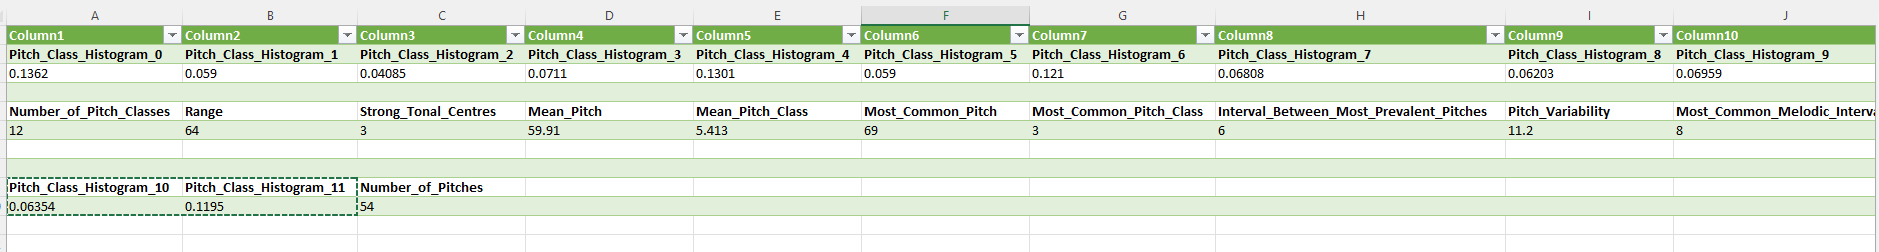
Features analysed:
Pitch Class Histogram, Number of Pitches, Number of Pitch Classes, Range, Strong Tonal Centres, Mean Pitch, Mean Pitch Class, Most Common Pitch, Most Common Pitch Class, Interval Between Most Prevalent Pitches, Pitch Variability, and Most Common Melodic Interval.
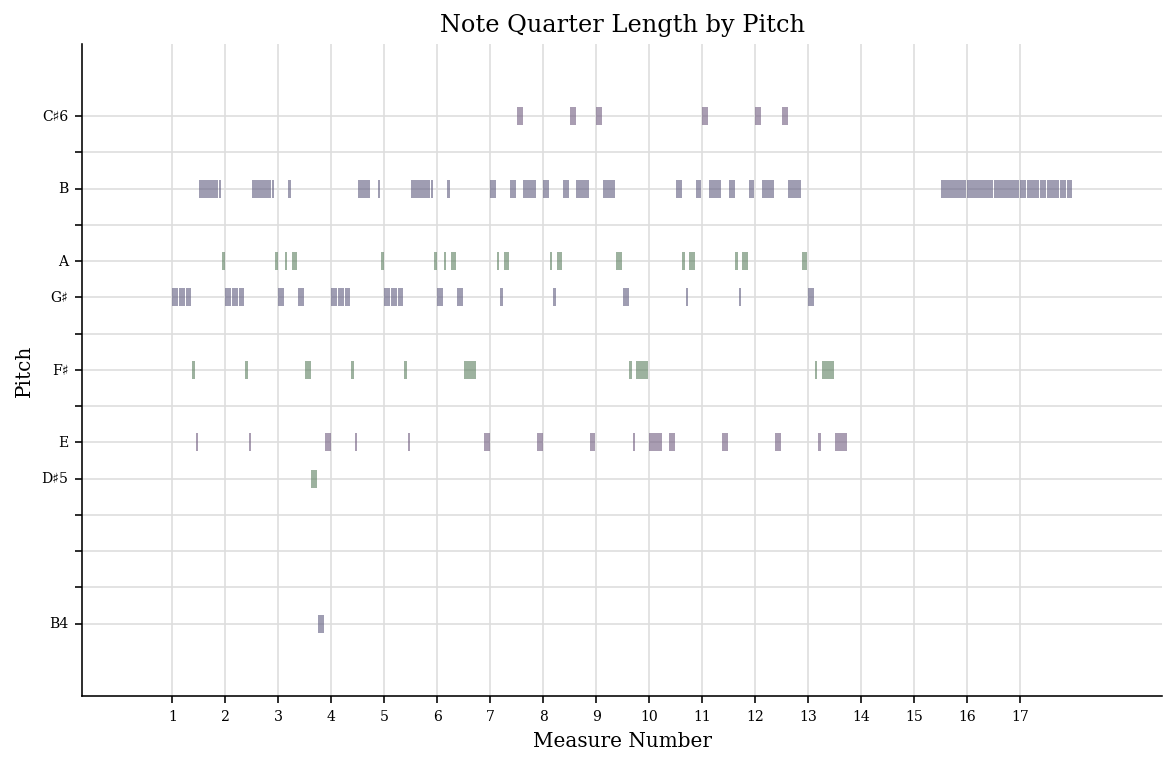
Part 2
Piano Roll of Violin 1, bars 1-17.
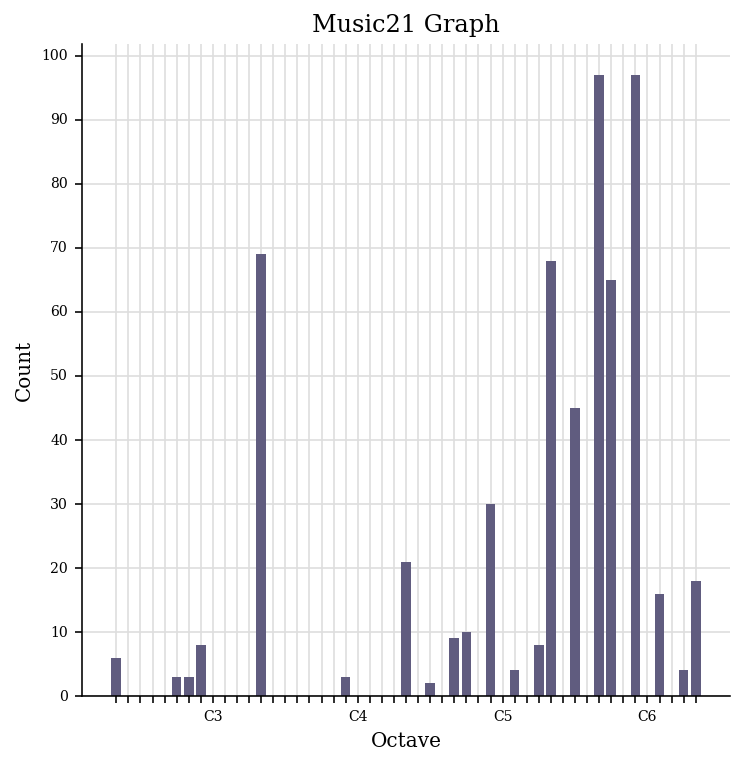
Pitch Historgram of Valvaldi’s ‘Spring’
Week 5
TASK: 1. Create a metadata schema by listing the elements (or a subset of at least 5 elements). 2. Modify your MEI document according to the schema that you have created. Where possible, enrich your data by linking it to existing authorities as discussed in yesterday’s lecture using the @auth.uri attribute. Be sure to follow the MEI metadata standards (https://music-encoding.org/guidelines/v4/content/metadata.html) for structuring your MEI header.
Metadata schema
- Title
- subtitle
- Composer
- Date
- Copyright
Week 7
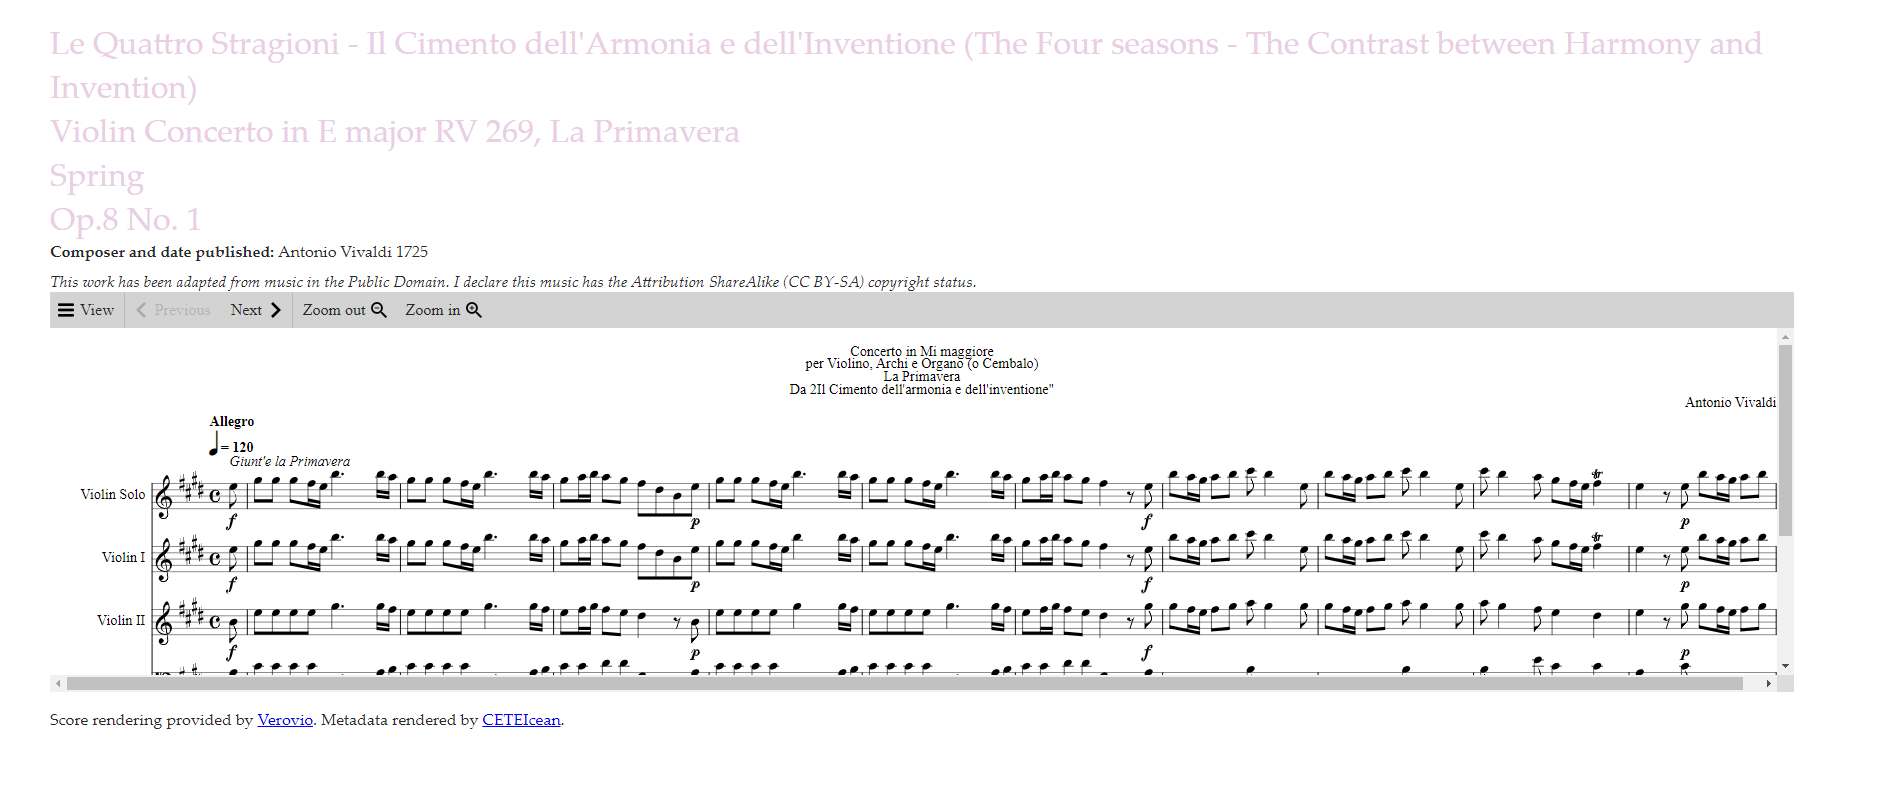
Task 1. Create a second version of your MEI file with the updated metadata with enlarged genre classifications, Specific licensing data (consider Creative Commons licenses) and any other metadata values that you think could be enhanced or modified
2. Render your revised MEI metadata along with your score on an HTML page.
After Rendering
Week 8
Task 1: Find and describe 3 audio tracks relating to your theme
1. Identify and download 3 music tracks relating to your theme. Ideally, these should be different in their sound and style.*
2. Identify and list (in a table) the most important technical and non-technical metadata associated with each track.
| Content | Track 1 | Track 2 | Track 3 |
|---|---|---|---|
| Link to recording | IMSLP recording link (https://imslp.org/wiki/Special:ReverseLookup/443513) |
Youtube link (https://www.youtube.com/watch?v=ZPdk5GaIDjo) |
Youtube Link (https://www.youtube.com/watch?v=jGFqtOdEIWk) |
| Title | Violin Concerto in E major, RV 269 ‘La primavera’ | Vivaldi Four Seasons: Winter (L’Inverno), original version. Freivogel & Voices of Music RV 297 4K | Vivaldi – Spring (The Four Seasons) |
| Artist | Canzona Music | Voices of Music | Rousseau |
| Composer | Antonio Vivaldi | Antonio Vivaldi | Antonio Vivaldi |
| Copyright info | Creative Commons Attribution 4.0 | No information – in public domain in YouTube | No information – in public domain in YouTube |
| Genre/Type of recording | Baroque Recording | Baroque – Fundraiser Concert | Modern Piano cover |
| Instruments | Classical ensemble | Baroque ensemble | Solo piano |
| Source | IMSLP | YouTube | YouTube |
| File/audio format | MP3 | MP3 | MP3 |
| Number of channels | 2 | 2 | 2 |
| Sample rate | 24kHz | 44.1KHz | 44.1Khz |
| Bits per second | 64kb/s | 128kb/s | 128kb/s |
| Duration | 12:06 minutes | 9:26 minutes | 4:01 minutes |
Task 2: Perform basic analysis of your 3 tracks in SonicVisualizer
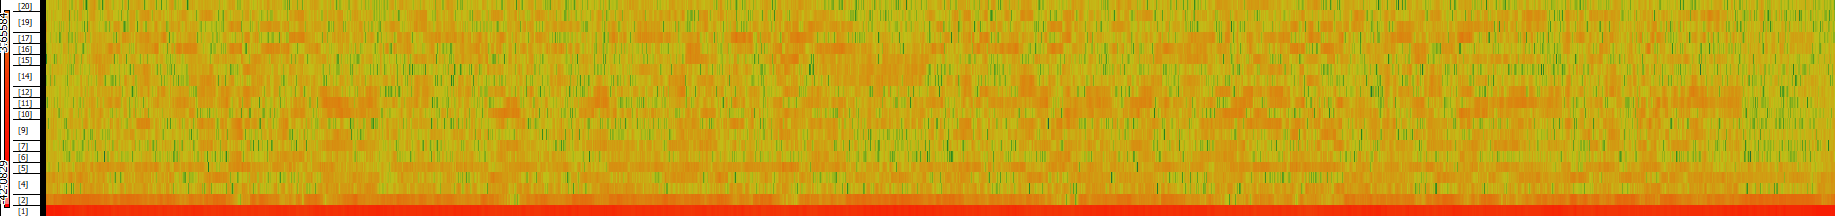
1. For each downloaded track, generate a spectrogram (with log-spaced frequency scale) in SonicVisualizer.
2. Export the waveform and spectrogram in an image format for your GitHub portfolio.
3. In 200 words (max), describe at least one advantage of a time-frequency analysis over a waveform-based analysis.
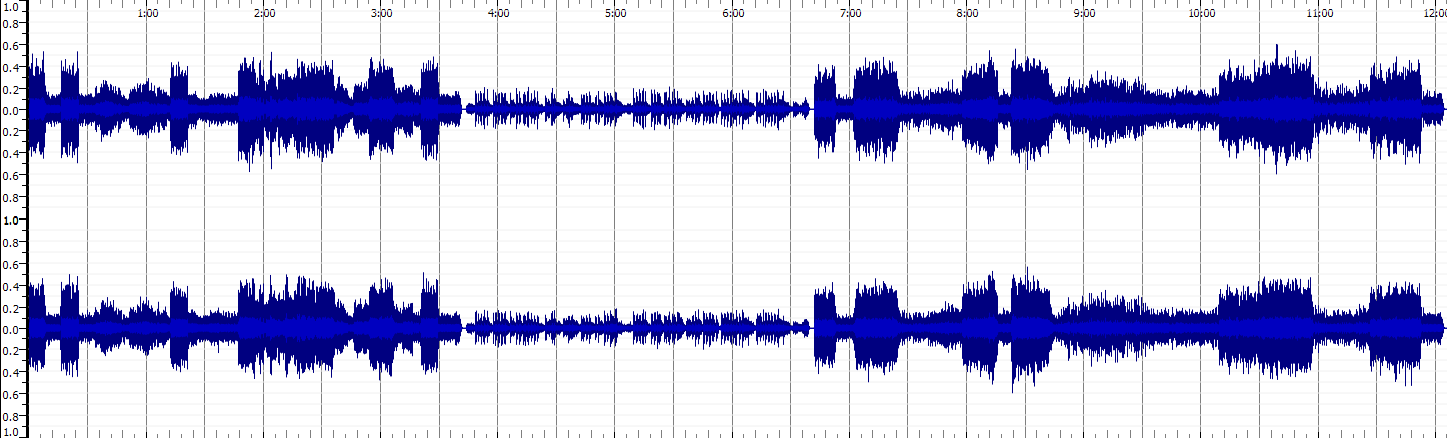
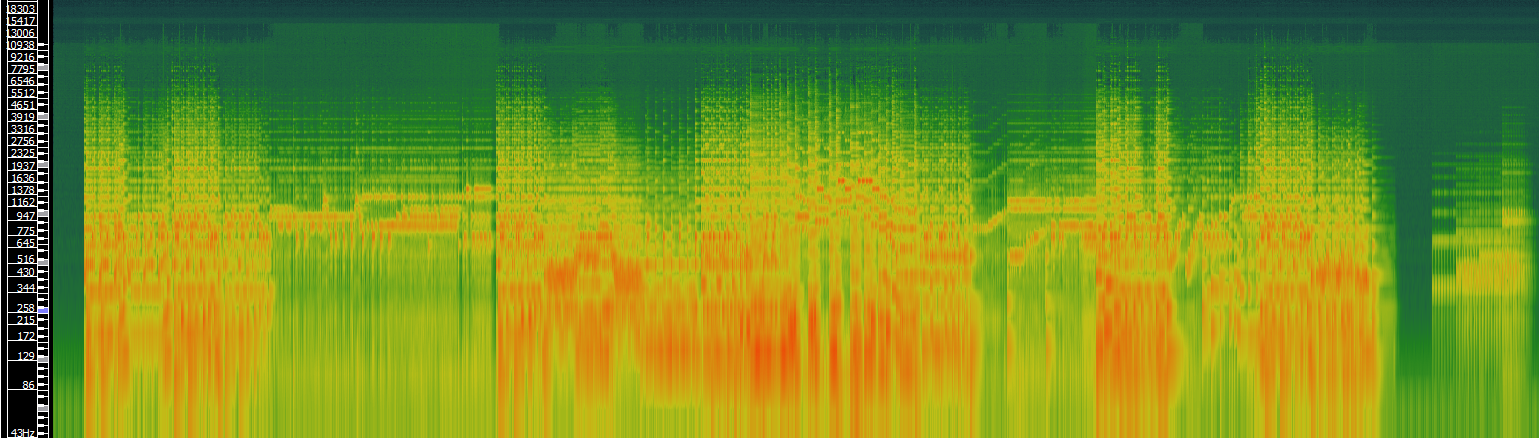
TRACK 1: Violin Concerto in E major, RV 269 ‘La primavera’
Waveform
Spectrogram
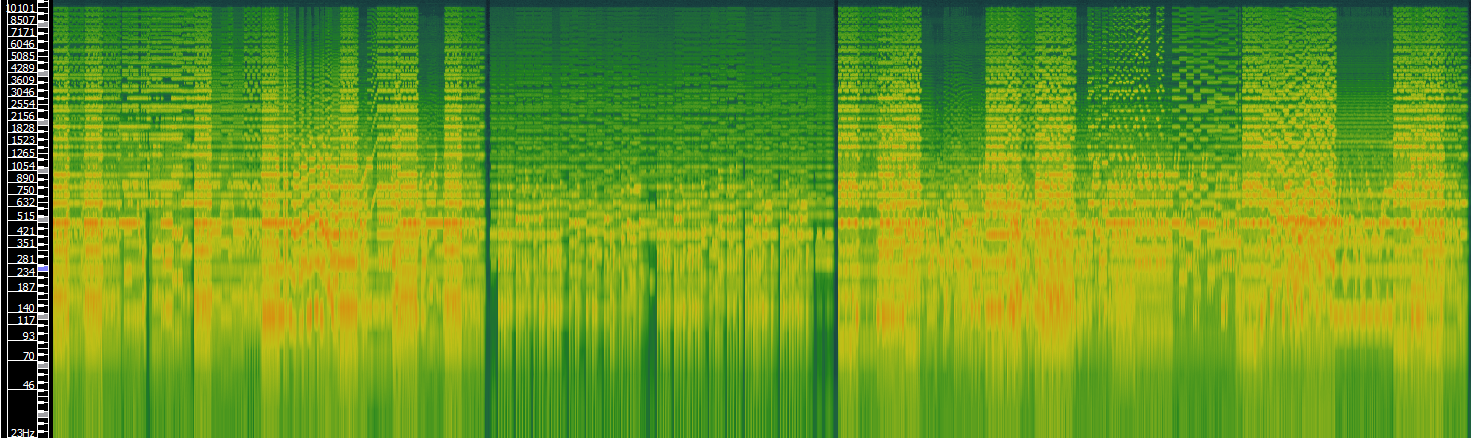
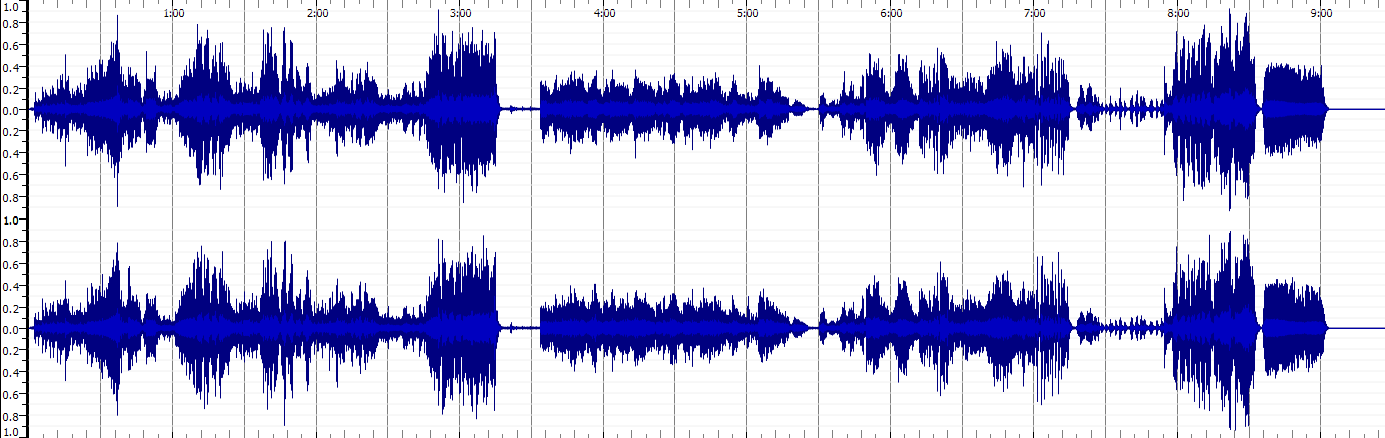
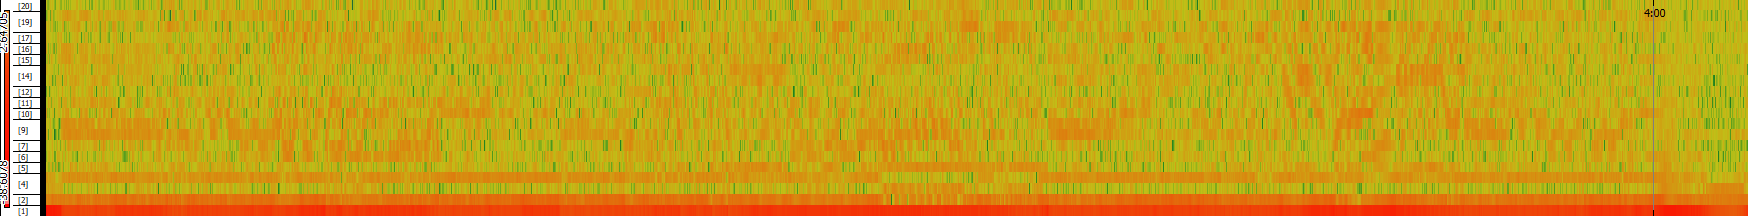
TRACK 2: Vivaldi Four Seasons: Winter (L’Inverno)
Waveform
Spectrogram
TRACK 3: Vivaldi – Spring - Piano
Waveform
Spectrogram
Time-frequency analysis vs Waveform analaysis Advantages
A time-frequency analysis allows you to have a clearer idea of the harmonic spectrum and notes that are present in the audio file. The waveform file can only give you a general idea of what the sound is like and when it starts and stops, or it increases and decreases in volume. It gives you an idea of the timbre of the music, (the attack, decay, sustain and release) but this alone can tell you very little of what instrument or instruments are present in the recording. By looking at the fundamental and subsequent frequencies the recording is producing, you can gain an idea of the type or style of instrument that is being used. In my examples above, the recordings get more vivid in the waveform and spectrograms. This could be due to the recording quality, however the recording on classical instruments is less resonant than the baroque instruments and the violin spectrograms have weaker fundamentals (strong red areas) than the solo piano. The single instrument perhaps elevates the accuracy of the spectrogram compared to the group of instruments in the previous recordings.
Week 9
Task 1: Extract features
1. Identify and download three music tracks relating to your portfolio theme from an online source (i.e. The Free Music Archive). NOTE - if your theme is centred on one piece of music, then use Audacity to break the recording of your piece into at least three sections (for instance: verse, refrain, bridge)
Recordings downloaded
All from Free Music Archive website
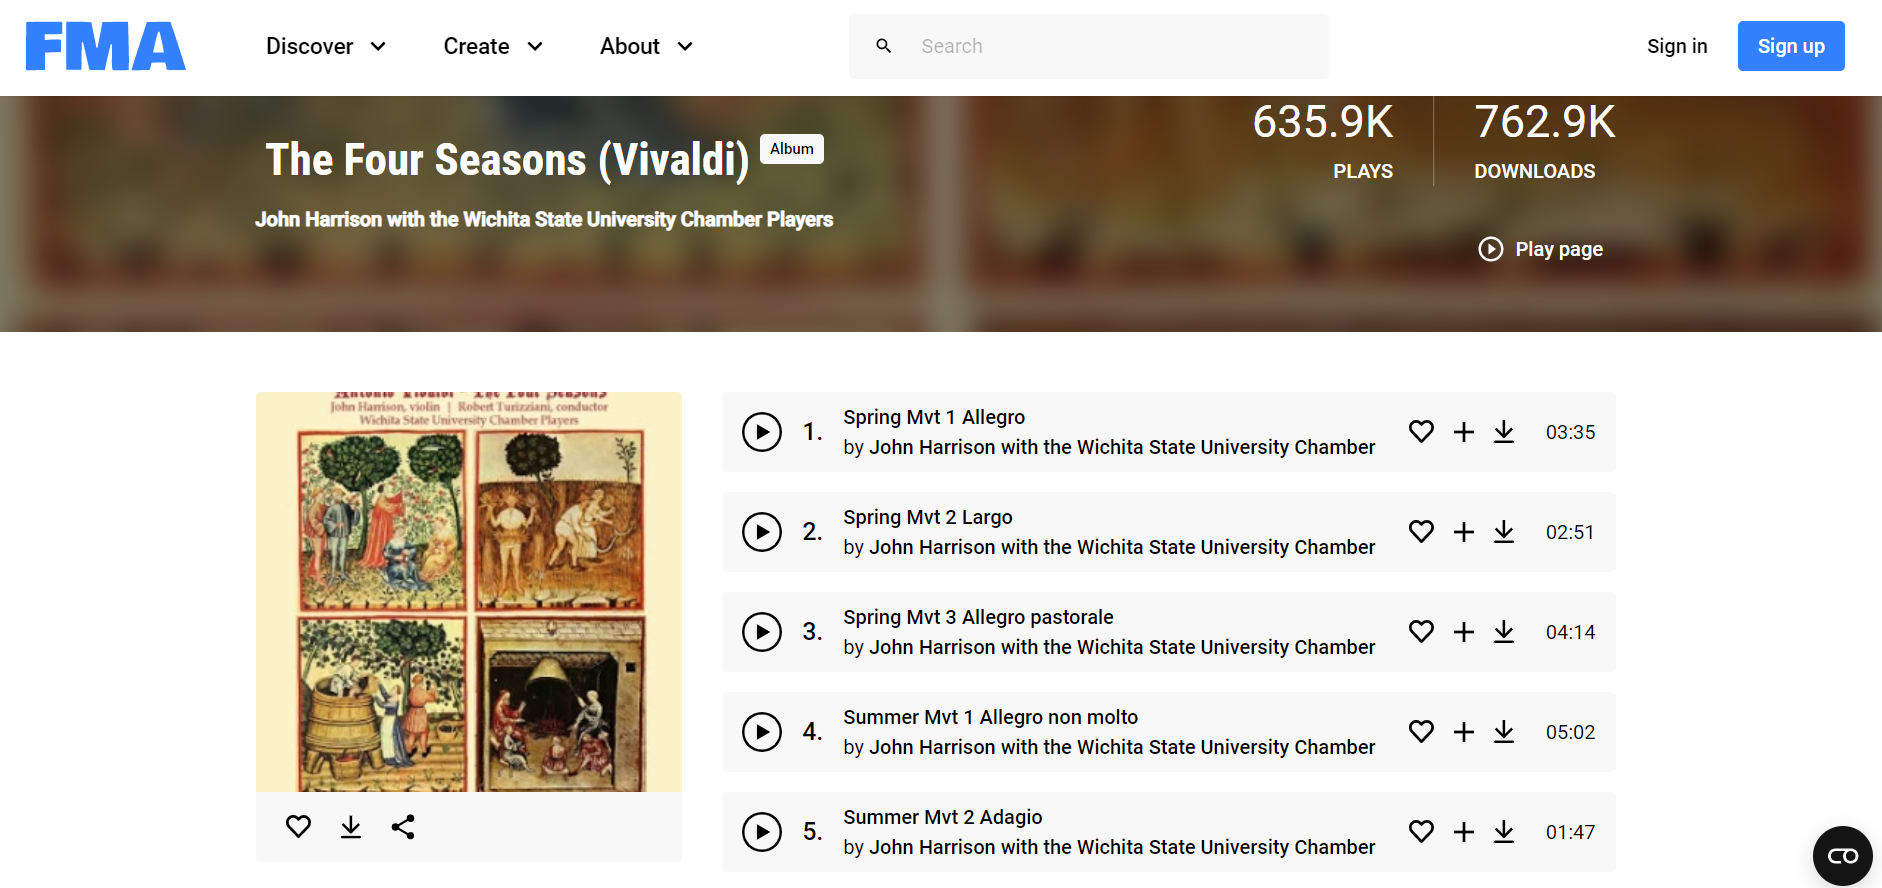
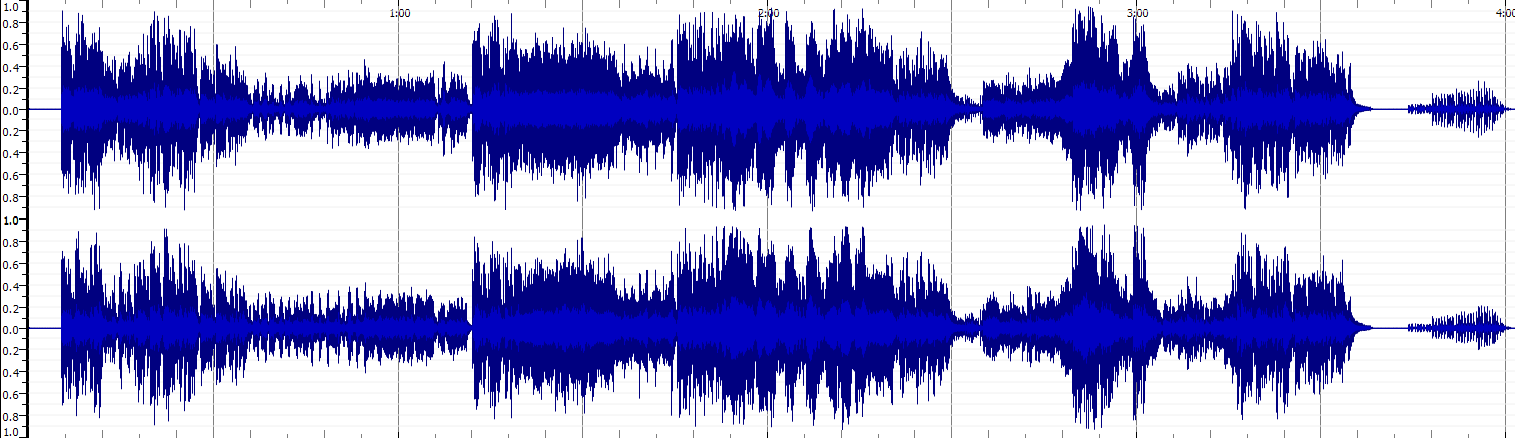
Music track 1: Vivaldi Four Seasons, Spring, Movement 1 (Allegro)
Music track 2: Vivaldi Four Seasons, Spring, Movement 2 (Largo)
Music track 3: Vivaldi Four Seasons, Spring, Movement 3 (Allegro Pastorale)
2. For each track:
Load the track and add 3 panes. One should be a Spectrogram, one a Mel Frequency Cepstral Coefficients, and one a Chromagram Take a screenshot of the panes (or export the annotation layers as an image) Save the three annotation layers as individual CSV files (i.e. the raw data)
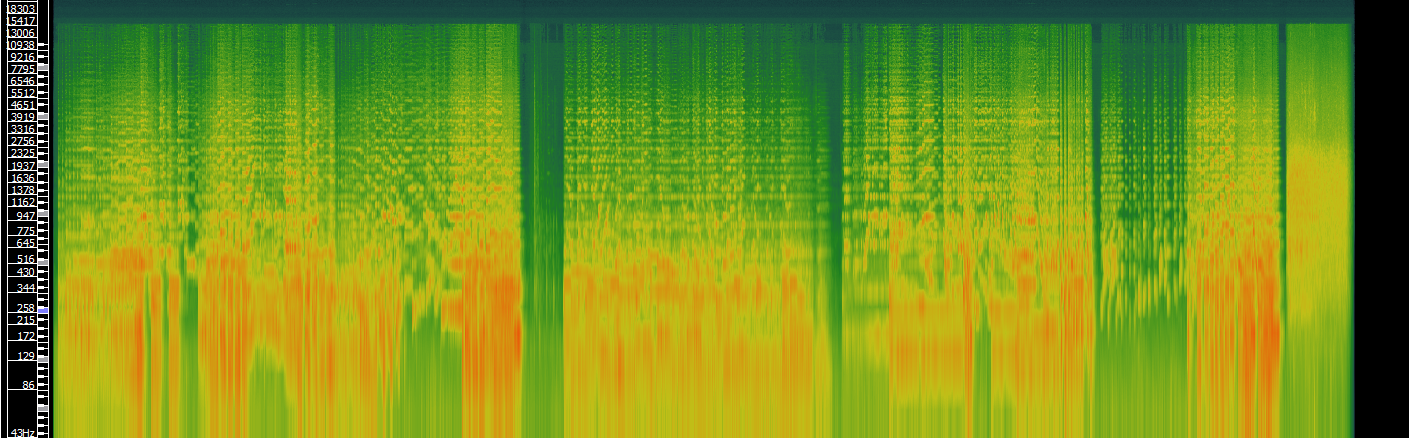
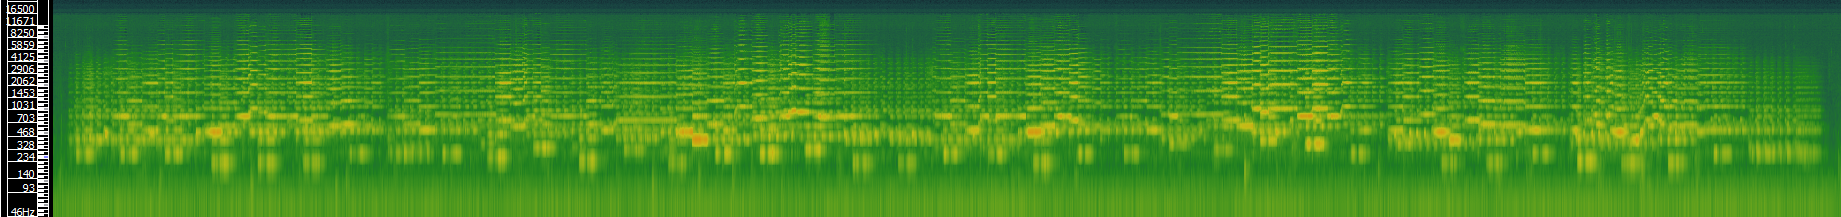
Spectrogram
Spring Movement 1

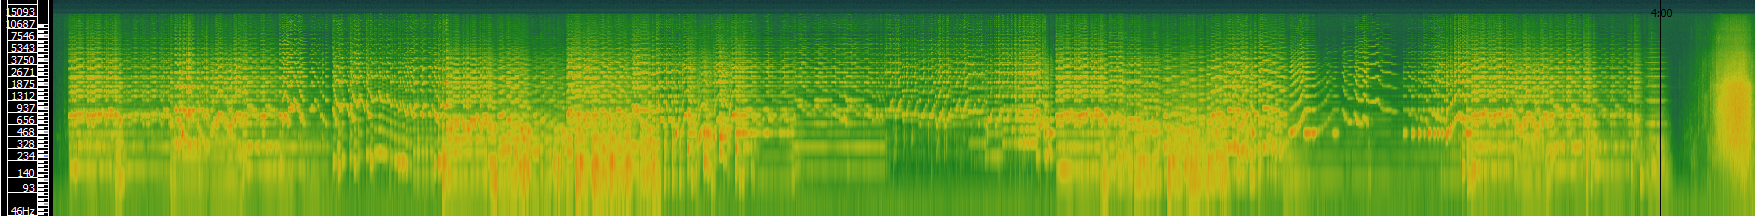
Spring Movement 2
Spring Movement 3
Mel Frequency Cepstral Coefficients
Spring Movement 1

Spring Movement 2
Spring Movement 3
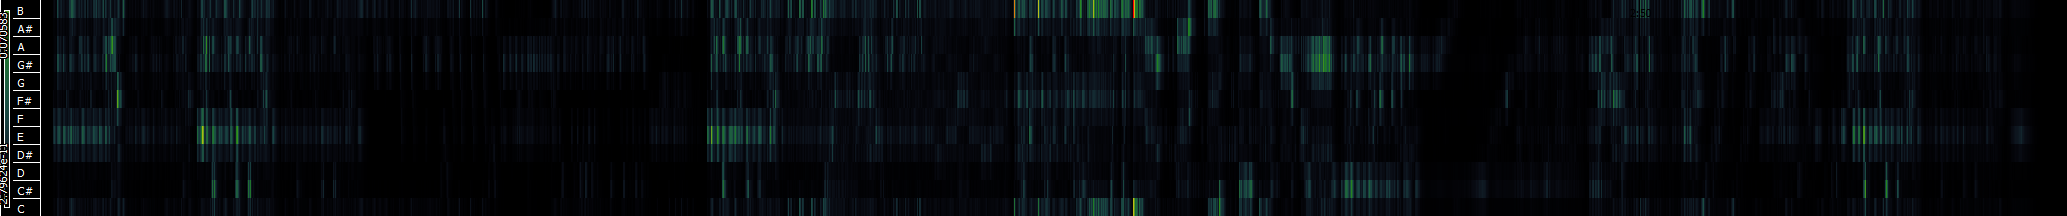
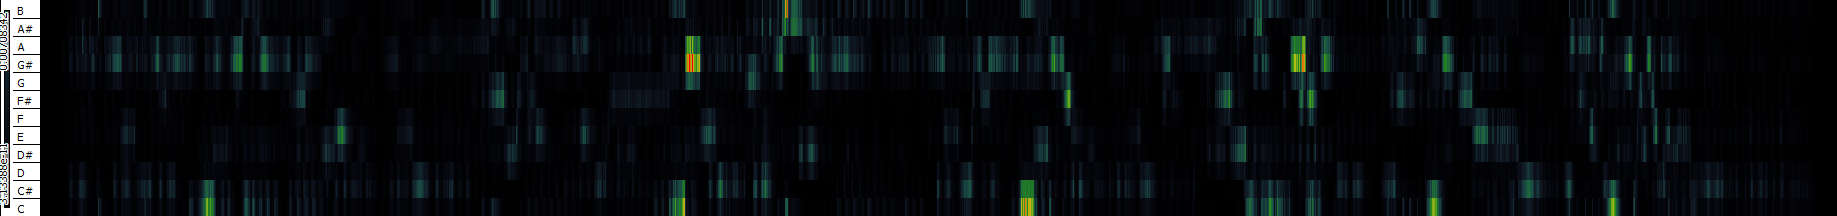
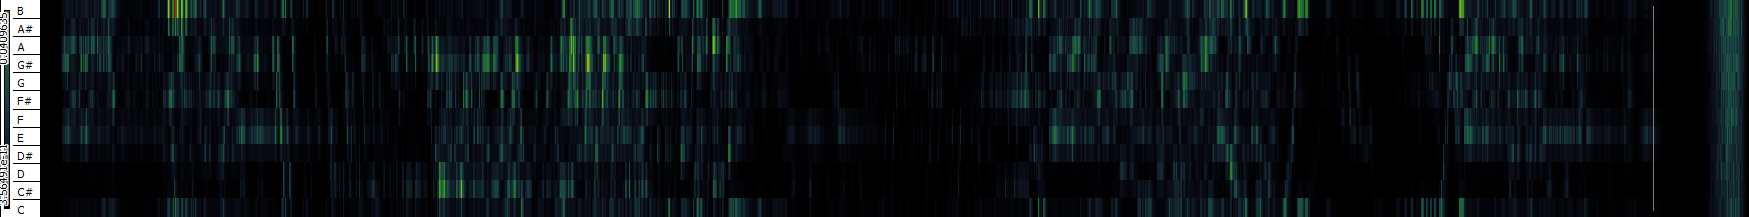
Chromagram
Spring Movement 1
Spring Movement 2
Spring Movement 3
Task 2: Compute and visualize features with histograms
For each track and feature type extracted in task 1:
1. In Python (Jupyter notebook or otherwise), load the three CSV files with the raw features
2. Compute and visualize the histogram of the features for the three tracks
3. For either the MFCC or Chroma feature, compare the histograms for the 3 tracks and highlight/discuss if the histograms capture significant differences between the tracks and if you expected this difference based on listening to the tracks (max 300 words)
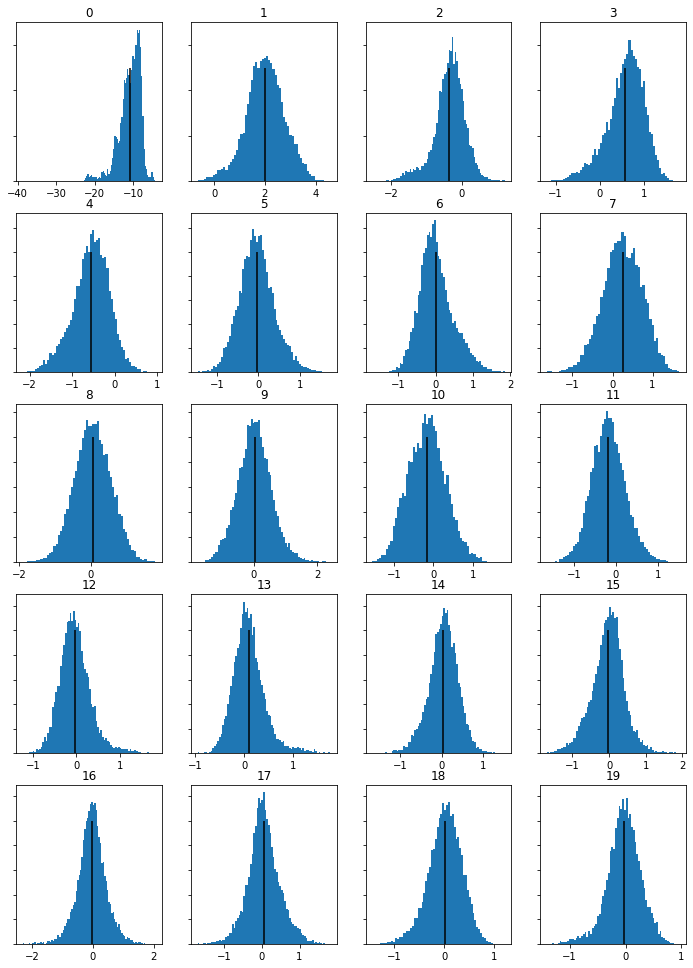
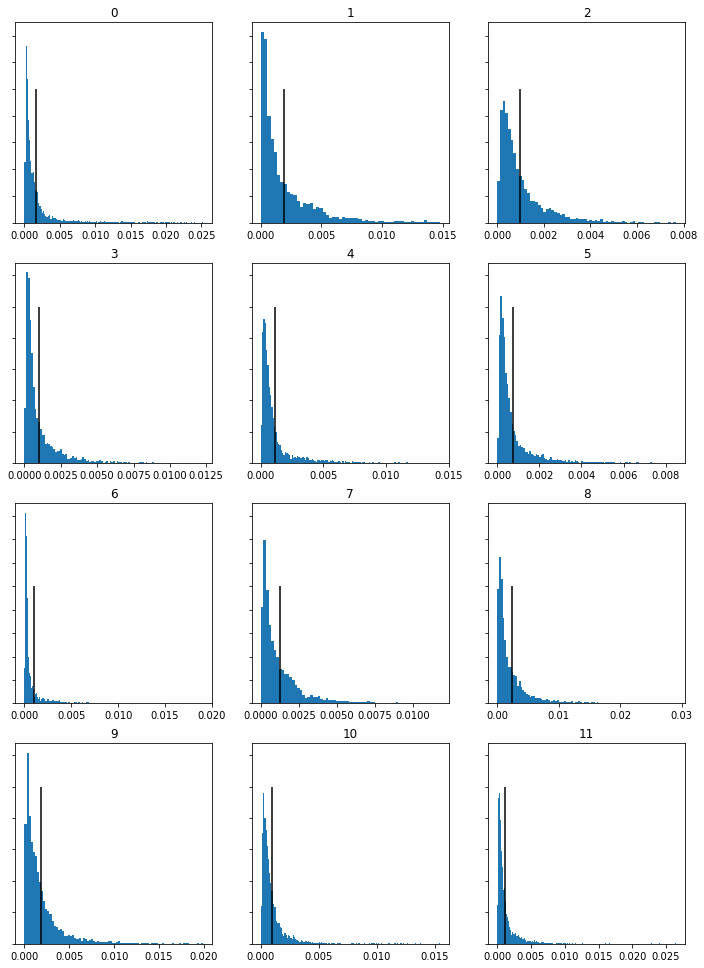
MFCC Histograms
Spring Movement 1
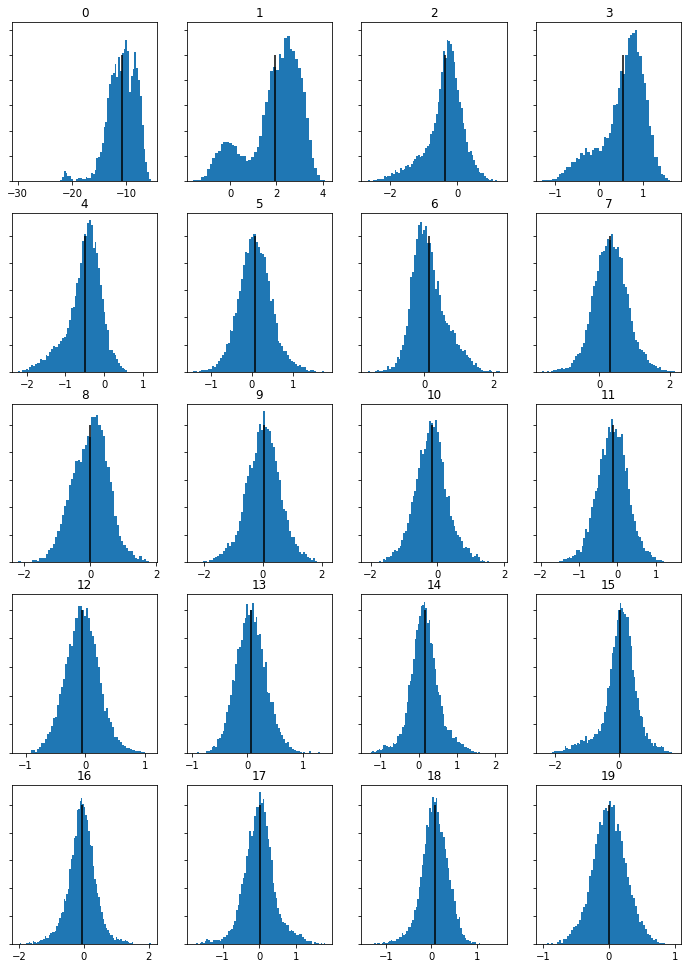
Spring Movement 2
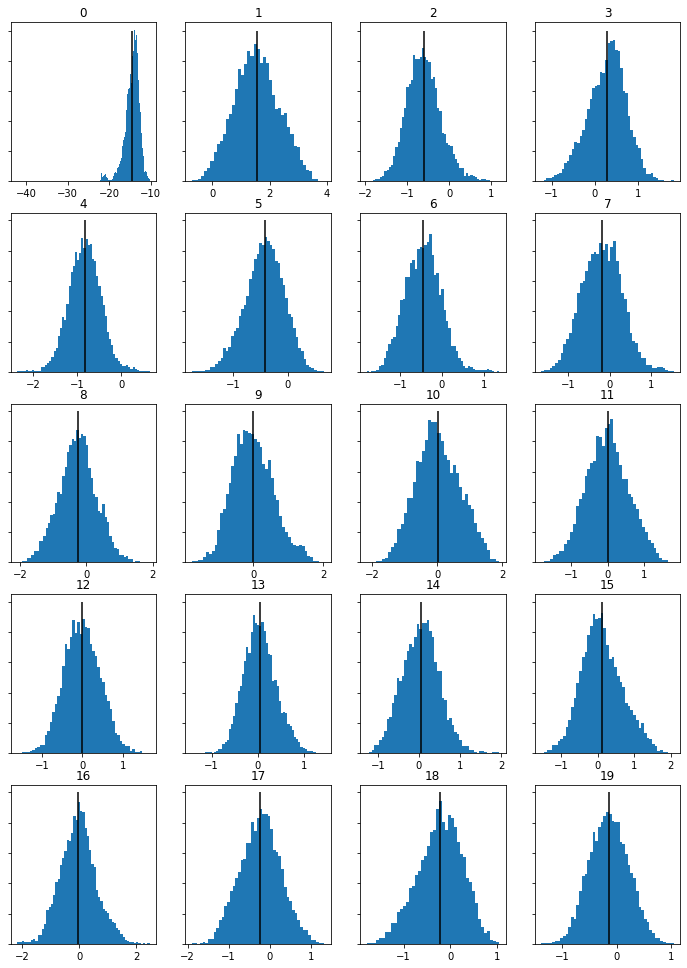
Spring Movement 3
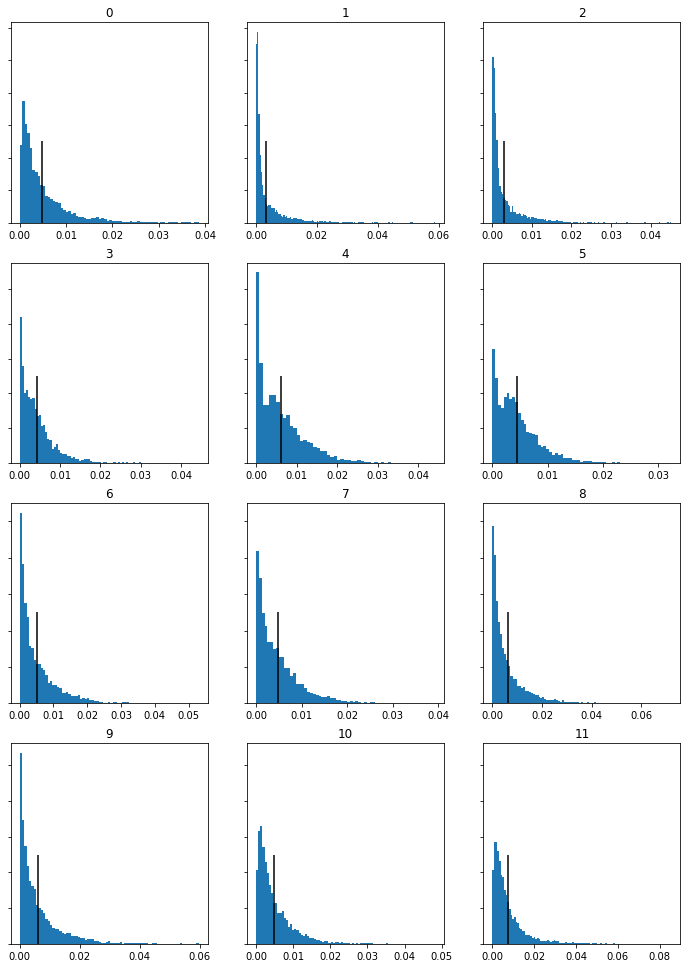
Chromagram Histograms
Spring Movement 1
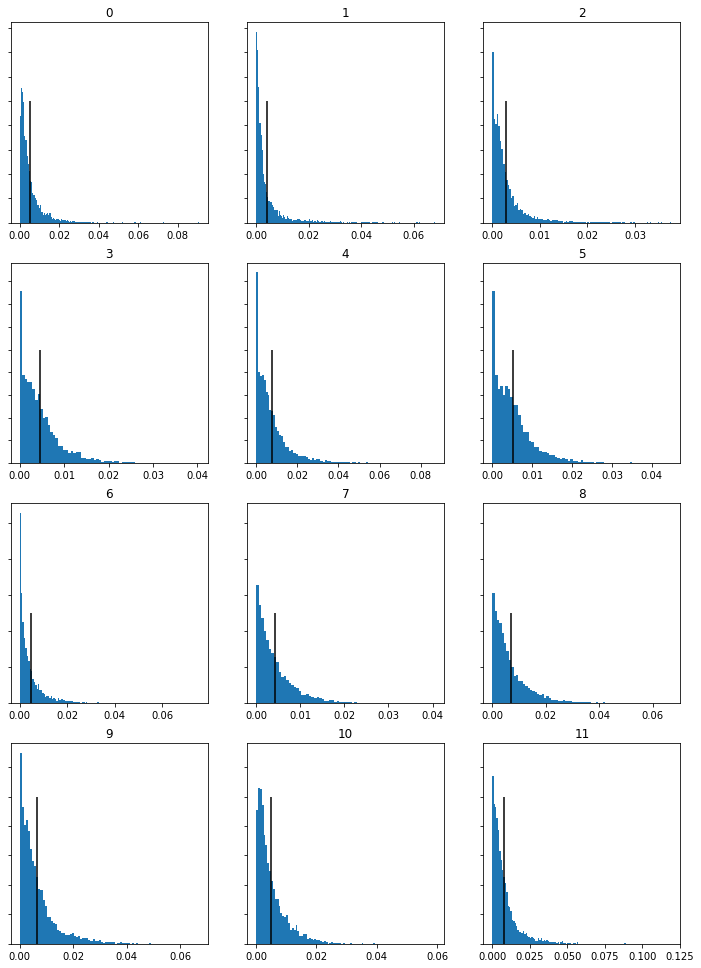
Spring Movement 2
Spring Movement 3
Comparison of Results
With MFCC graphs focusing on the timbre of the tracks, these are all very similar, accuratly reflectoing that all three tracks arep played by the same group of instruments. The Chromagram features, on the other hand, have difference, with the second movement chroma feratures standing out. Because the chroma feature focus on the melody and the demonstrate the amounts of each notes present in a track this makes logic sense. The second movemobe is quite a contrast melodically, focusing on a slower melofy and different tune to the first movement. Many of the 11 graphs between moevment 1 and 2 show differing shapes (numbers 1, 2, 3,, 5, 6, 7, 8) whereas in movment 3’s chromagram histograms many are similar in shape, apart from 10 and 11, suggesting there are similar melodic lines in movements 1 and 3. This makes sense when you listen tomovement 3, where you can hear familiar melody lines from movement 1, demonstrating the link between the analytical data and the aubile similarities/differences upon listening.
Week 10
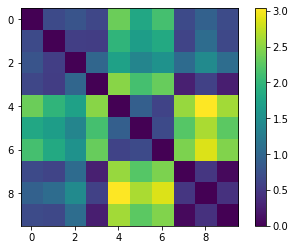
Task 1: Similarity Matrix
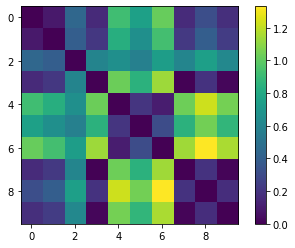
Open the same Python notebook from Tuesday’s group activity. Replace the country tracks with 3 tracks that relate to your portfolio’s theme (or the same tracks you used in last week’s individual lab). Generate a similarity matrix. This involves:Extracting the Chroma features in SonicVisualizer, Exporting the features as a CSV. Save the code and notebook and save the visualization of the similarity matrix as an image for your portfolio
Similarity graphs
Task 2: Transcription
Open your piece of music from Week 2 in MuseScore. Export it as a WAV file and as an image file. Open the WAV file in SonicVisualizer. Transcribe the file. Open the MIDI file in MuseScore. Export it as an image. In your portfolio, display both images and compare the transcription, reflecting on its accuracy and identifying any information that has been lost (max 200 words)
Comparison of Results
There is very little similarity at all between the two files. A first look, they appear almost the opposite of each. The most obvious difference is the fact the computer recognized the strings as a piano. Perhaps the number of strings led to this not working. Despite this, the scoring has picked up that there are multiple notes being played, even if transcribed as piano chords.
When listening again, you predominantly here clashes and dissonances, not the tuneful melody of the famous Vivaldi piece. Despite incorrectly transcribing the key, (Eb rather than E) if you the notes at face value, it has recognised some of the pitches. For example, the first chord in the transcribed version starts with and E chord, the same with the original version. Furthermore, there are some elements of rhythm that has been picked up including beginning in quavers and the two semiquavers-quaver motif in the first full bar of both the original and the transcripted version.
Overall, however this is a fairly unsuccessful transcription, showing the limitations computers have and therefore show there are still areas in music where human input is more effective.
Image of score pre-transcription


Image of score post-transcription

